
Technical Indicators
Technical indicators are mathematical calculations used in trading to analyze historical price data, volume, and market trends. They are essential tools in technical analysis, which helps traders predict future price movements and make informed decisions about entering or exiting positions in both stock and cryptocurrency markets.
Types of Technical Indicators
Technical indicators can be broadly categorized into several types, each serving a specific purpose:
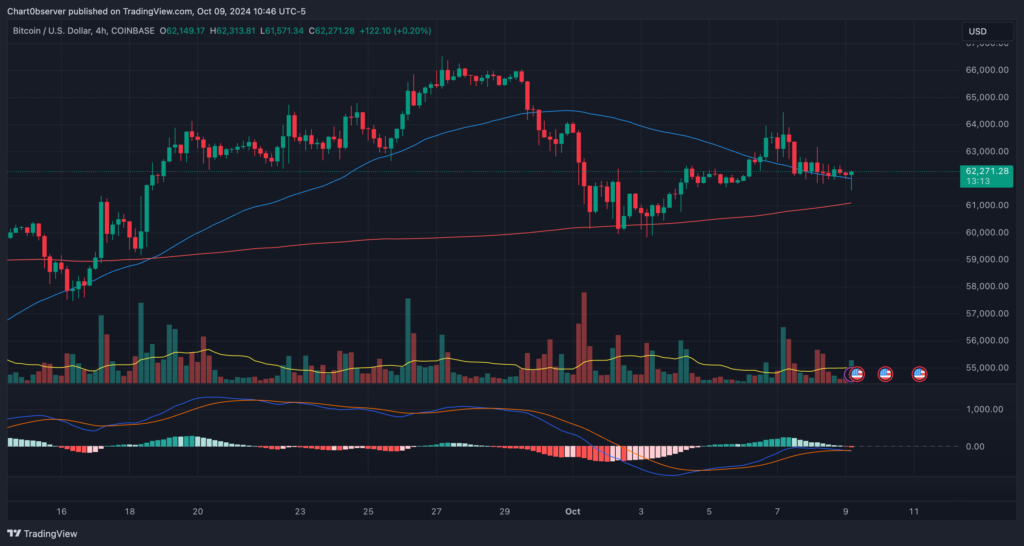
- Trend Indicators: These help identify the direction of the market trend. Examples include Moving Averages (MA) and Moving Average Convergence Divergence (MACD). Moving Averages smooth out price data to identify trends, while MACD uses the difference between two MAs to signal buy or sell opportunities[1][2][4].
- Momentum Indicators: These measure the speed and strength of price movements. The Relative Strength Index (RSI) is a popular momentum indicator that identifies overbought or oversold conditions by comparing average gains and losses over a specific period[2][4].
- Volume Indicators: These assess the strength of a market move by analyzing trading volume. On-Balance Volume (OBV) is an example that helps identify buying or selling pressure based on volume changes relative to price movements[1][6].
- Volatility Indicators: These measure the rate at which prices change. Bollinger Bands, for instance, use a moving average and two standard deviation lines to indicate volatility levels. When prices move outside these bands, it suggests high volatility and potential overbought or oversold conditions[1][3][4].
Application with Candlestick Charts
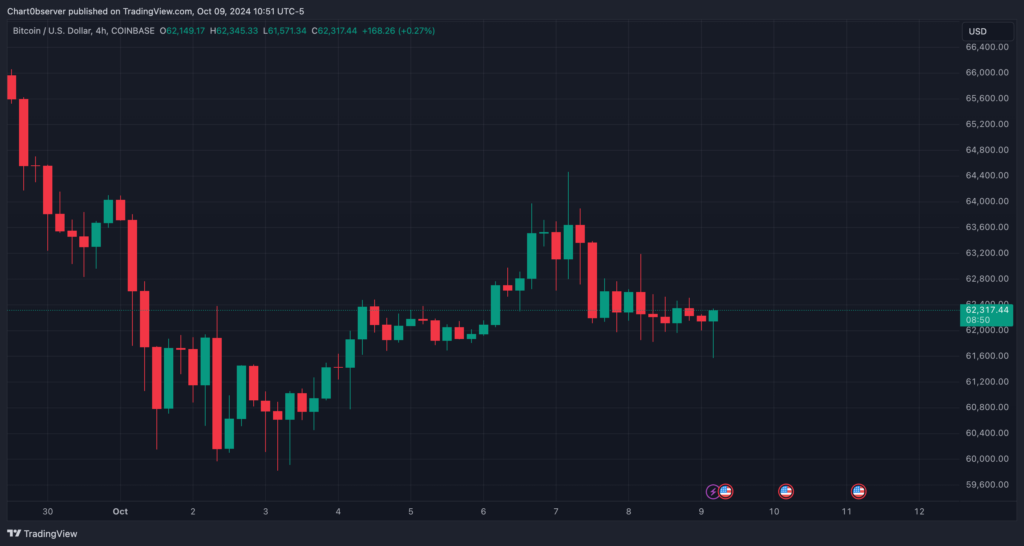
Candlestick charts are a popular tool for visualizing price movements in trading. Each candlestick represents a specific time period and shows the opening, closing, high, and low prices. Technical indicators are often used alongside candlestick charts to provide additional insights:
- Trend Identification: By overlaying moving averages on candlestick charts, traders can easily spot trends and potential reversals.
- Momentum Analysis: RSI can be plotted below candlestick charts to identify periods when an asset might be overbought or oversold.
- Volatility Assessment: Bollinger Bands can be drawn around candlesticks to visualize volatility levels and potential breakout points.
Using these indicators in conjunction with candlestick charts allows traders to gain a more comprehensive view of market conditions, enhancing their ability to make strategic trading decisions.
Using Indicators at Tradingview.com
Our documentation frequently mentions the Tradingview platform because it is a very popular toolset that traders use to evaluate price action. We are not directly affiliated with Tradingview, but you should know that we do receive an affiliate commission for sending them new customers. Regardless of whether you choose to use their free plan, or paid subscription, they provide you with a wide range of technical indicators. We are including this video from Tradingview which describes how you might work with indicators on their charts.
Why use indicators with Chart.Observer?
- Indicators can alert you to interesting price action
- You may decide to act on that information quickly
- Many indicator alerts can be forwarded to chart.observer
- You can see those trades show up in your dashboard automatically
The chart.observer platform is designed to compliment a trader’s existing toolset or trading “system”. We don’t tell you when or what to trade, those are decisions that you must make. So if you choose to perform technical analysis with a 3rd party candlestick charting tool, just know that these indicators often produce “alerts”. When a technical indicator notifies you about an interesting price movement or trend, you may decide to trade that. Such alerts are often capable of being forwarded to another website like ours. The chart.observer platform has a ‘webhook” API for receiving those alerts, which we talk about in greater detail in another Knowledge Base article on Automating Trades.
The following image shows the various ways in which Tradingview can send notifications of these indicator alerts, at the time of this writing:

In the above example, the “Webhook URL” is the notification method you would use to send the alert to chart.observer as a buy or sell signal. Although this example is specific to the Tradingview platform, many other technical analysis and charting programs are capable of sending notifications to other websites like ours.
You can read more in depth descriptions of the Tradingview indicators here:
Indicators – Tradingview
What is an Indicator – Tradingview
Citations:
[1] https://www.altrady.com/crypto-trading/technical-analysis/what-are-technical-indicators
[2] https://coindcx.com/blog/cryptocurrency/10-best-indicators-for-crypto-trading/
[3] https://www.bitpanda.com/academy/en/lessons/important-indicators-in-crypto-trading/
[4] https://cointelegraph.com/learn/cryptocurrency-investment-the-ultimate-indicators-for-crypto-trading
[5] https://onetrading.com/blogs/crypto-technical-analysis-techniques-indicators-and-applications
[6] https://www.tokenmetrics.com/blog/best-indicators-for-crypto-trading-and-analysis//